Python in Data Visualization: Best Tools and Libraries
By Emancipation Edutech Pvt. Ltd, Ranchi
Introduction
In the modern data-driven world, visualization plays a vital role in understanding and interpreting complex information. Raw data alone doesn’t tell the full story — it’s the visuals that reveal insights, trends, and patterns. This is where Python shines as one of the most powerful and flexible programming languages for data visualization.
Python’s simplicity, extensive libraries, and community support make it the top choice for both beginners and professionals. In Ranchi, students and tech enthusiasts are increasingly turning to Emancipation Edutech Pvt. Ltd to master these Python visualization tools and become skilled data professionals.
Why Python for Data Visualization?
Python stands out because of its:
- Ease of use: Its simple syntax allows you to create visualizations quickly.
- Rich ecosystem: Multiple libraries like Matplotlib, Seaborn, and Plotly make data visualization powerful and versatile.
- Integration: It easily connects with data analysis tools like Pandas, NumPy, and machine learning frameworks.
- Customization: You can tailor every visual aspect, from basic charts to interactive dashboards.
Top Python Libraries for Data Visualization
Let’s explore the most widely used Python libraries that are shaping the future of data visualization:
1. Matplotlib
One of the oldest and most powerful visualization libraries, Matplotlib is often called the foundation of data visualization in Python.
- Ideal for line charts, bar graphs, scatter plots, and histograms.
- Highly customizable — from colors and labels to axis formatting.
- Integrates seamlessly with Pandas for quick plotting.
Example use:
import matplotlib.pyplot as plt
plt.plot([1,2,3,4], [10,20,25,30])
plt.title('Simple Line Plot')
plt.show()
2. Seaborn
Built on top of Matplotlib, Seaborn simplifies complex visualizations with a clean and modern style.
- Great for statistical data visualization.
- Offers built-in themes and color palettes.
- Easily handles large datasets and produces publication-quality visuals.
Example: Heatmaps, pair plots, and regression plots are Seaborn’s strong suit.
3. Plotly
For interactive and web-based visualizations, Plotly is a top choice.
- Enables zooming, panning, and tooltips for data exploration.
- Perfect for dashboards and real-time data monitoring.
- Works with frameworks like Dash to create interactive web apps.
This is widely used in data analytics training at Emancipation Edutech Pvt. Ltd Ranchi to teach students how to build live dashboards.
4. Bokeh
Bokeh specializes in building interactive visualizations for web browsers.
- Ideal for creating dynamic dashboards.
- Allows integration with web technologies like HTML and JavaScript.
- Can handle streaming data, making it perfect for live data visualization.
5. Altair
Altair is known for its simplicity and declarative approach.
- Allows users to describe visualizations in terms of “what” rather than “how.”
- Best for clean and statistical graphics.
- Lightweight and integrates easily with Jupyter Notebooks.
Real-World Applications
Python’s visualization tools are used in a variety of industries, such as:
- Business Intelligence: Creating reports and dashboards for decision-making.
- Healthcare: Visualizing patient data and health trends.
- Finance: Tracking market trends, stock prices, and portfolio performance.
- Education & Research: Data analysis and visualization for academic projects.
At Emancipation Edutech Pvt. Ltd, Ranchi, learners are trained to apply these libraries to real-world projects — helping them become industry-ready data professionals.
Learning Data Visualization at Emancipation Edutech Pvt. Ltd, Ranchi
Emancipation Edutech Pvt. Ltd is one of the best Python and Data Analytics training centers in Ranchi, offering practical, hands-on training in:
- Python fundamentals
- Data analysis using Pandas and NumPy
- Visualization using Matplotlib, Seaborn, Plotly, and more
- Real project-based learning for students and professionals
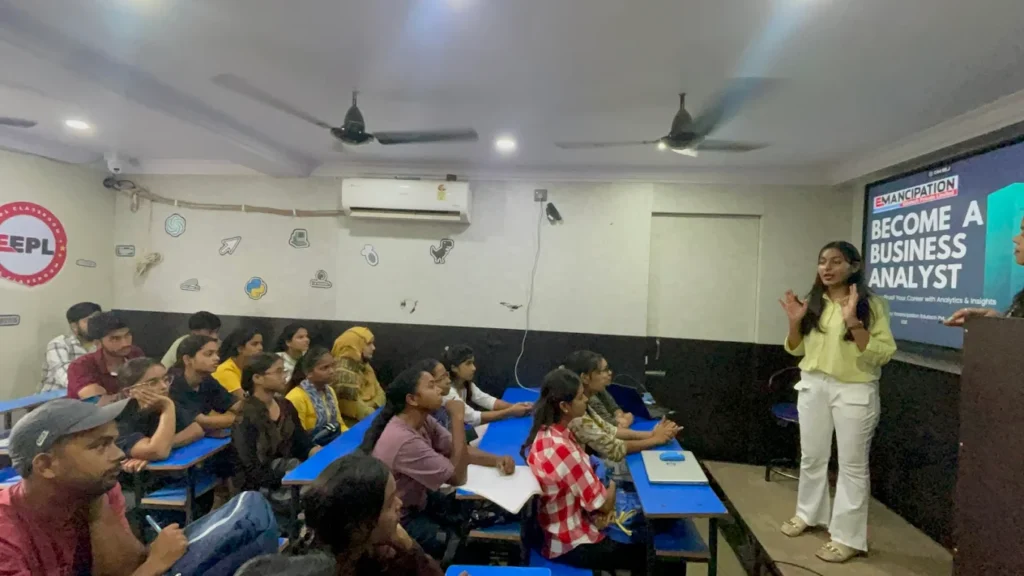
The institute also conducts workshops and training programs across colleges in Jharkhand to promote skill development in AI, ML, and Data Science.
Conclusion
Data visualization is not just about making charts — it’s about telling a story with data. Python provides all the necessary tools to turn data into meaningful visual insights. Whether you are a beginner or a professional, learning Python visualization through a structured program like Emancipation Edutech Pvt. Ltd Ranchi can open doors to countless opportunities in data analytics and AI.
So, if you’re ready to bring your data to life — start your Python journey today with Emancipation Edutech Pvt. Ltd, the best data visualization and Python training center in Ranchi.
- SUMIT SINGH
- Phone Number: +91-9835131568
- Email ID: teamemancipation@gmail.com
- Our Platforms:
- Digilearn Cloud
- EEPL Test
- Live Emancipation
- Follow Us on Social Media:
- Instagram – EEPL Classroom


